
Activate your free ClimaCheck Energy Report

With ClimaCheck online all necessary parameters are monitored and analysed to work with Predictive maintenance. By activating the quarterly Energy Report (free) you will receive a comprehensive energy report that includes information on the electricity that is used, when it is used and how much heating/cooling that is produced.
In the core offer of ClimaCheck online, the quarterly Energy Report is included and you can activate the Energy Report by emailing us.
All the information needed is collected without any invasive sensors.
Functions in the Energy report
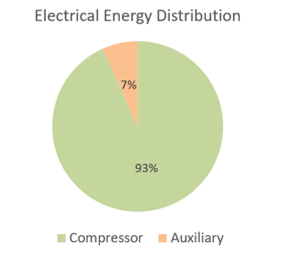
Electrical energy distribution graph presents the relative energy consumption of the compressor and the auxiliary loads such as pumps and fans. The graph is helpful to illustrate the effect of the auxiliary loads on the overall energy consumption.
Energy used and generated graph shows the consumed electrical energy by the compressor and the auxiliary units compared to the generated heating and cooling energy. The graph represents the performance of the plant over the report period.

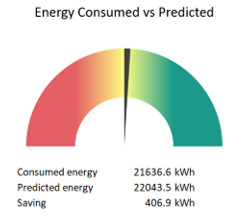
Energy consumed vs predicted graph shows the energy consumption of the plant compared to the predicted energy consumption. The predicted energy consumption is based on historical data of the same plant. This can help to determine the amount of savings after a plant optimization, or to show a degradation of the plant’s performance.
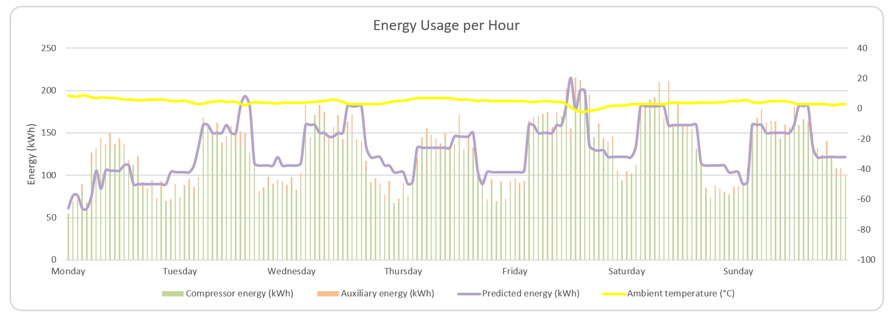
Energy usage per hour shows in detail the actual and predicted energy consumption of the plant as well as the ambient temperature over the report period. The chart shows the effect of the ambient temperature on the energy consumption and the hours where savings are achieved compared to the predicted energy or the hours with excessive energy consumption compared to the predicted energy.
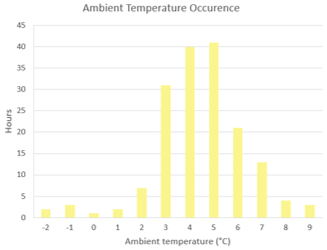
Temperature occurrence shows the number of hours during which a certain ambient temperature has occurred. It is helpful to take this into account when comparing the energy consumption and performance of a system for two different periods or when comparing the performance of two systems in different locations.
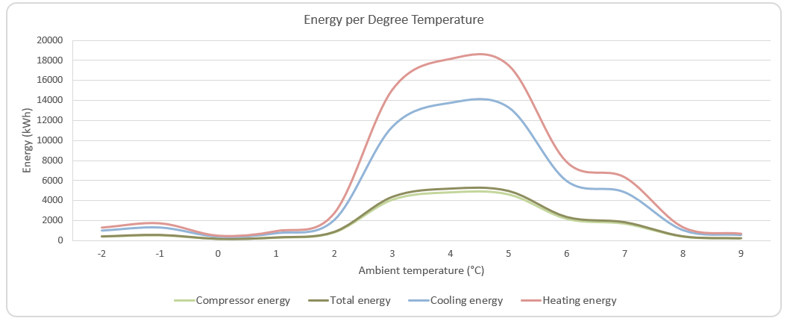
The energy consumption at different ambient temperature shows the consumed electrical and generated heating/cooling energy for each ambient temperature that occurred during the report period. The graph helps in localizing the temperatures where most energy is used and where the optimization should be focused on.
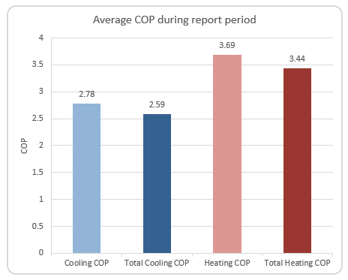
The average COP during the report period shows the cooling and heating COP with and without the effect of the auxiliary loads.
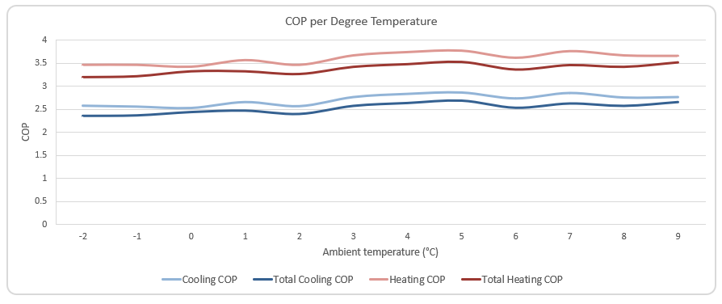
The COP at each occurring ambient temperature shows a more detailed report of the heating and cooling COP, averaged per degree temperature occurred during the report period.
If you want to activate the energy report today, contact us
More news

World Refrigeration Day 2025 – Technology, Climate Action and an Industry Progressing into the Future.
June 26th marks World Refrigeration Day, a day to recognise the technology that enables life as we know it.

Office Hours During Midsummer Celebrations and the Summer
We wish you a joyful Midsummer celebration filled with happiness
New Employee, the ClimaCheck network is growing!
Say hello to Julian Schoch our new COO! Speaking German, English and Swedish, he’ll be a familiar face (and voice) to many of you in our daily communication.
