ClimaCheck Online update – Start and stop statistics!


Start and stop has a major impact on lifetime expectancy of compressors and contribute to energy inefficiency of plants.
Another important aspect of frequent start and stops is that frequent changes in capacity, result in changes of all controls in the system and destroys system stability. Without any stability in system it is impossible to adjust controls correctly or verify performance and functionality with accuracy. Many years of experience show that plants with the same or similar design can operate with extremely different start and stop characteristics depending on commissioning of controls.
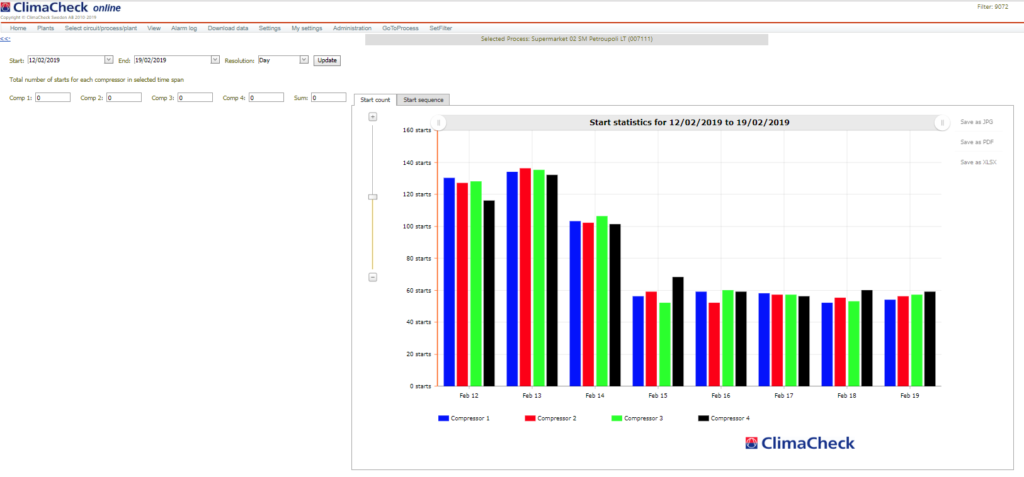
The column to the left shows the start counts for more than 20 racks were the number of starts varying from 17 to over 1000 starts per 24 hour – 1000 starts per 24 hours correspond to almost 1 start per minute.
A poorly running HVACR system is expensive to run!
It will consume more energy and have more failures/breakdowns that is expensive to repair. When compressors start over 1000 times in 24 hours, it is a no-brainer that it is bad for the system efficiency. If there isn’t staff present 24/7 keeping track of the compressors and simultaneously monitor everything else in the system, it might be hard to know why the compressor short cycle and thus it is hard to fix what causing the problem. It is likely that nobody knows there is a problem in the system as it has not crashed yet and it reach the temperatures that is desired (for now).
Do not run to Failure!
A typical example is a chiller that is set to deliver 6°C and as long the desired temperature is reached everyone is probably satisfied. How do you know that the chiller isn’t using 30% more energy than necessary? One of the compressors might be starting and stopping every few minutes? You can have liquid refrigerant reaching the compressor at some operating conditions, or the wrong charge of refrigerant?
With ClimaCheck online you can see these and many other problems in your smart phone or your PC and get early warning. So, when a problem occurs and performance starts to deviate, it is in the majority of cases possible to plan a maintenance and work predictive instead of going out after a system breakdown.
It is also stressful for all involved when system is down often with high secondary costs in loss of production or perishable goods and disappointed and frustrated customers.
Server view.
An example of a rack with 4 compressors is shown in Figure 1. The Start and End dates can be chosen from the top part. The Resolution is set for a Day if multiple days are selected or for Hour if a single day is being analysed. The number of starts of each compressor is shown for every day

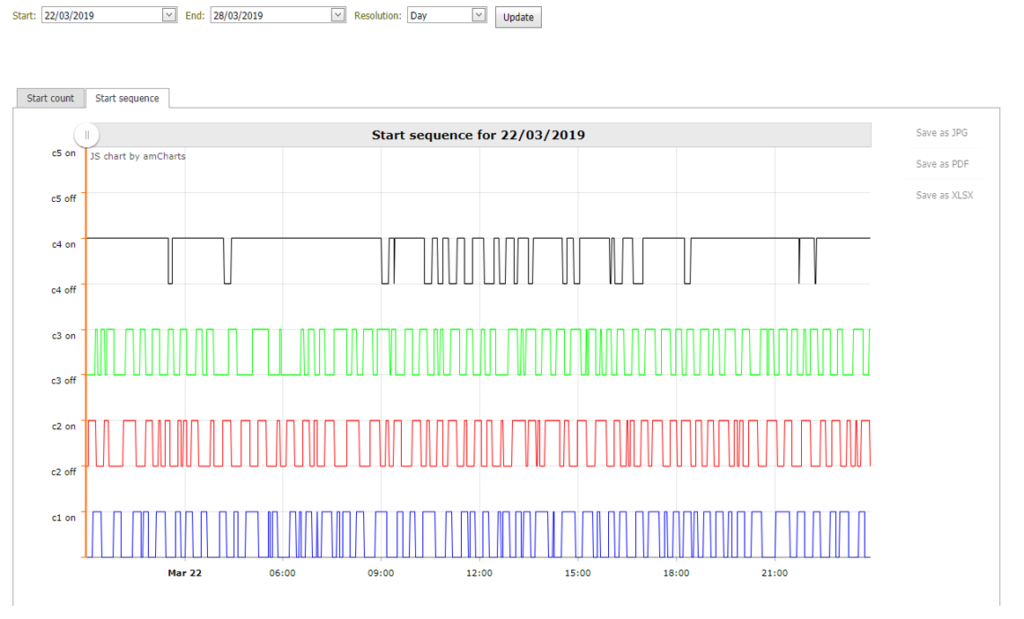
Figure 2 shows the start and stop sequence of the compressors for the first day of the selected date range. This can be done by selecting on the Start sequence tab on top of the graph. Each line represents one compressor. The line goes up when the compressor is turned on and goes down when the compressor is turned off.

Figure 2
Instruction how to activate the function can be found in the ClimaCheck online manual.
If you are interested in taking the next step towards predictive maintenance contact us for more details and information on what we can do to improve your business.
More news

ClimaCheck online – Maintenance – 6-7/7
During this weekend (sixth and seventh of July), ClimaCheck online will be through some planned maintenance.

HVACR optimisation and the potential reduction of CO2!
Multiple organisations have evaluated the saving potential within HVACR optimisation, and reached similar conclusions: it is possible to reduce CO2 emissions by millions of tons by optimising HVACR systems.

Midsummer celebration and information on our office hours for the Summer!
This special time of year brings us together to enjoy the light, dance around the Maypole, and welcome the summer!
