-26% energy consumption
-70 000 kWh/month
Increased stability
Lower carbon footprint
Case
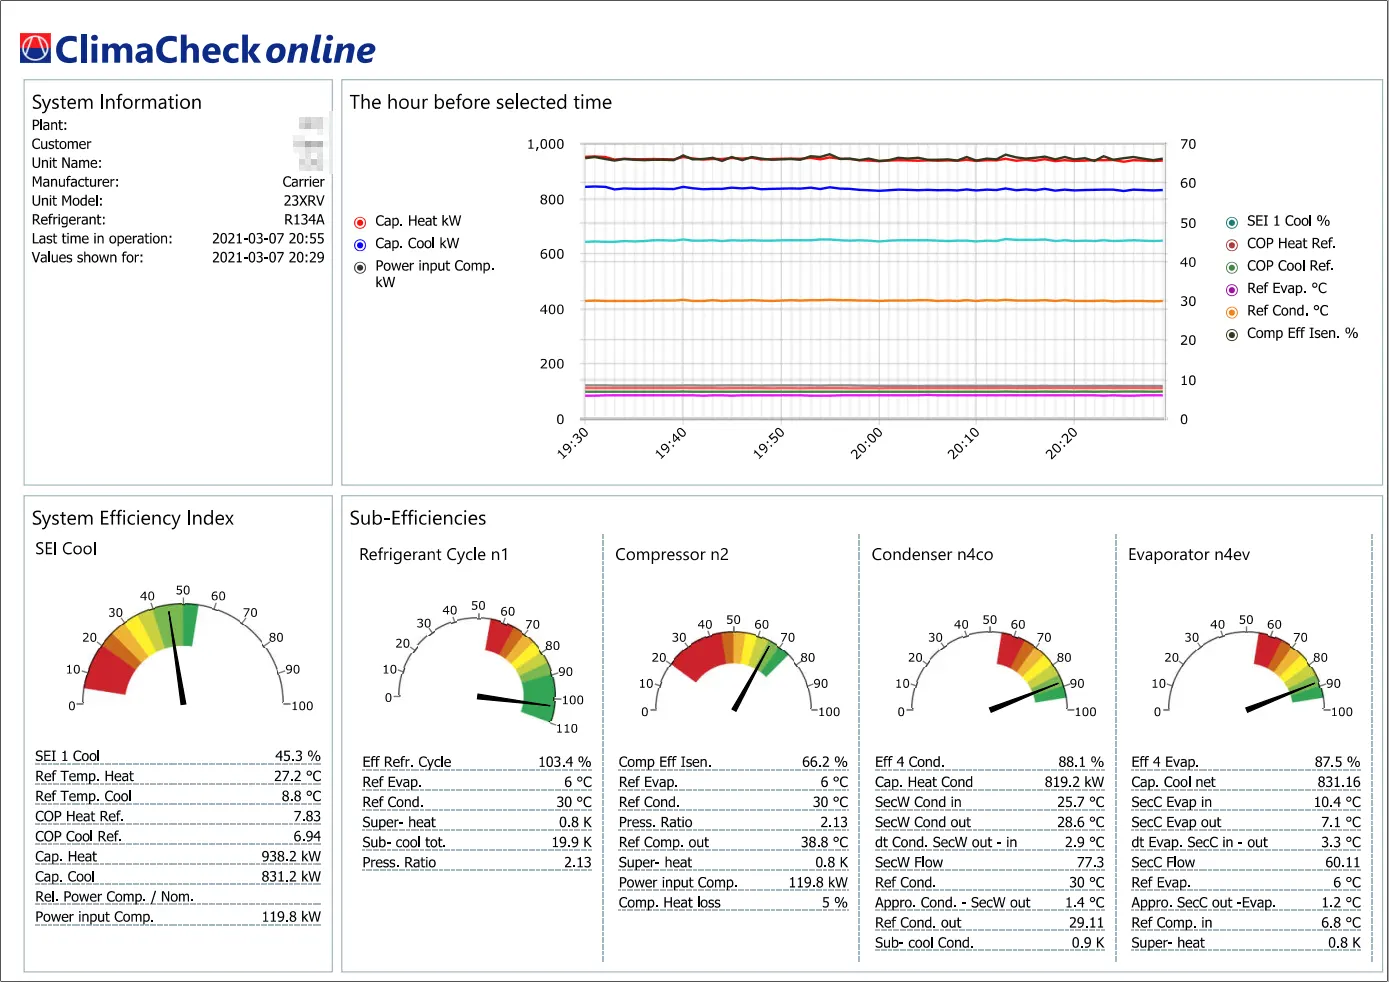
Regardless of a systems “age”, it is important to ensure stable operation to avoid problems and performance drift. This is done, for example, by ensuring stable temperature levels on the hot and cold sides of a refrigerator or heat pump. To ensure that the new heating and cooling system at KTH was energy efficient, the performance is analysed with ClimaCheck. Analysing performance makes it possible to monitor and analyse the system’s efficiency and sub efficiencies. The information is necessary to work with energy optimisation and predictive maintenance, i.e., optimising the plant’s operation to reducing the risk of breakdowns and downtime.
Implementation
ClimaCheck online was integrated with the system during installation. As many sensors already are installed as standard today, the installation is easy and cost-effective.
Results
With the performance analysis from ClimaCheck, all involved parties received precise information about the system’s performance. This meant that all the necessary information to working with energy optimisation and predictive maintenance was available. So, it was possible to avoid problems related to poor operation from day one. The initial optimisation resulted in a reduction in energy consumption by 70,000 kWh per month, corresponding to 26% of energy use. After optimisation, the operation was improved, which reduced the risk of accidents and costly service measures. When performance deviates in the system, ClimaCheck online can send a warning to the person responsible for the operation. This creates an opportunity to work with predictive maintenance so breakdowns can be avoided. 
Energy signature
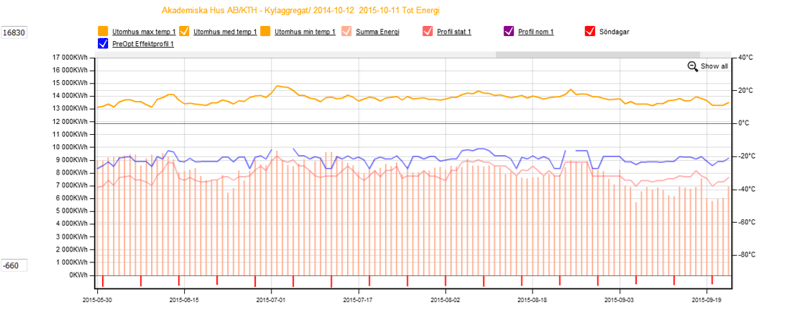
The energy signature below shows how optimisations and adjustments have been made over time. On 15/6, some adjustments were made, and then ClimaCheck online continued to analyse performance and created a new energy signature. Around 20/8, further optimisation measures were taken, and the result is clearly visible with the reduced energy consumption. Energy consumption per day is shown with red bars. The energy signature before the optimisation is illustrated in blue. After the optimisation, the new energy signature is displayed with a red line. The energy-saving is the difference between the blue line and the red bars. Contact ClimaCheck for more information about the project.  To learn more about the E2B2 project follow this link
Other projects


